Using the Filter View
The Filter View provides you with an interface to find the experiments you’re interested in based on experimental conditions. This way you can choose your experiments of interest, before you actually query the database for the experimental data.
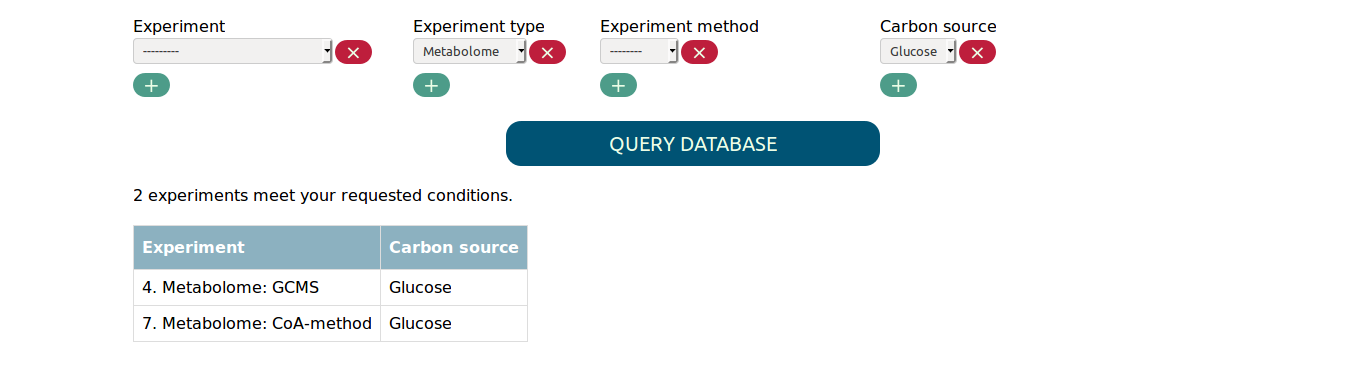
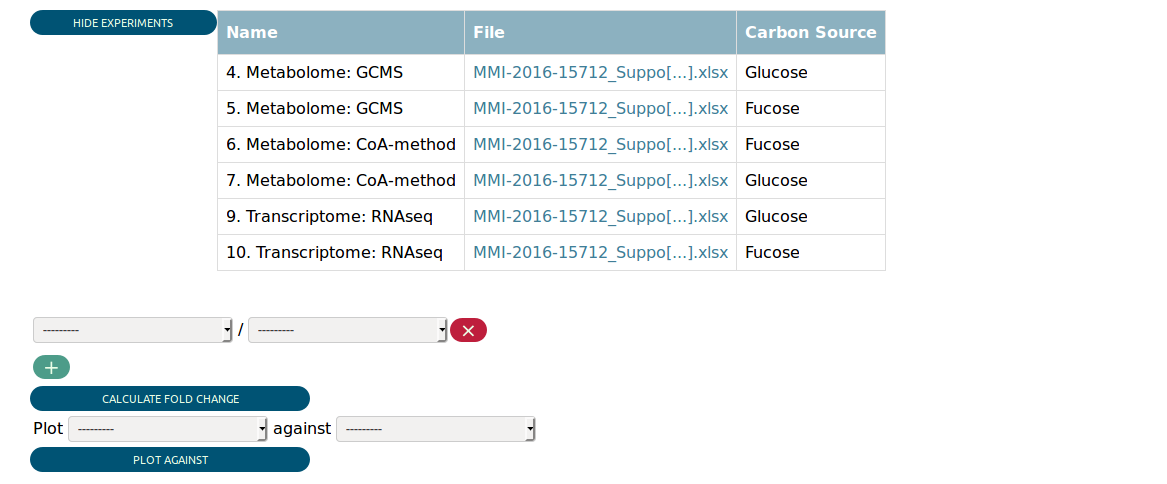
You find a select widget for each experimental parameter. Whenever you change the options you selected, the table summarizing the matched experiments will be updated. For example, if you want all metabolome experiments with carbon source glucose, you will get the following result.
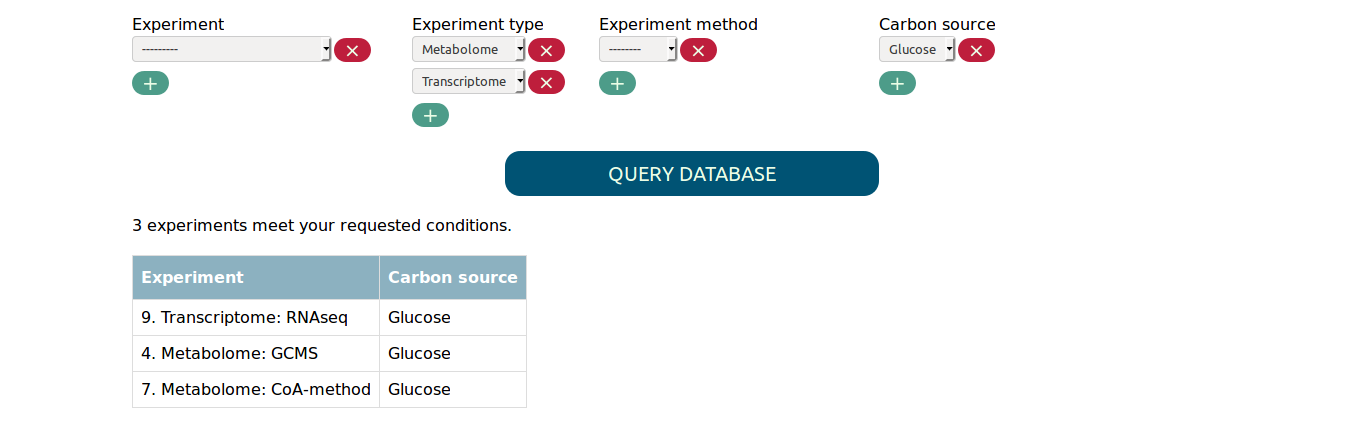
If you are interested in more than one value for the same parameter,
you can simply add another select box using the + button. This way
you can for example find all metabolome and transcriptome experiments in
which glucose was used as carbon source.
Note that multiple values for the same parameter are connected by
a logical OR and values for different parameters are connected
by a logical AND when looking for matching experiments. The above
input, for example, would be equivalent to the expression:
Experiments with (type metabolome OR type transcriptome) AND carbon source glucose
In order to find experiments that compare two conditions you need to select both values in the respective parameter. For example, to find the proteome experiment that compares fucose to glucose as carbon source you need to select the following:
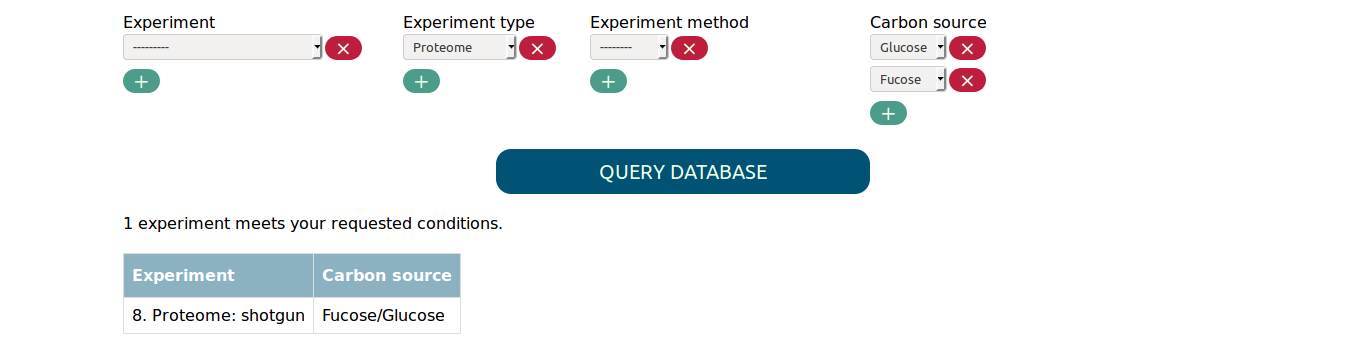
Selecting only fucose or glucose as carbon source would not match the experiment.
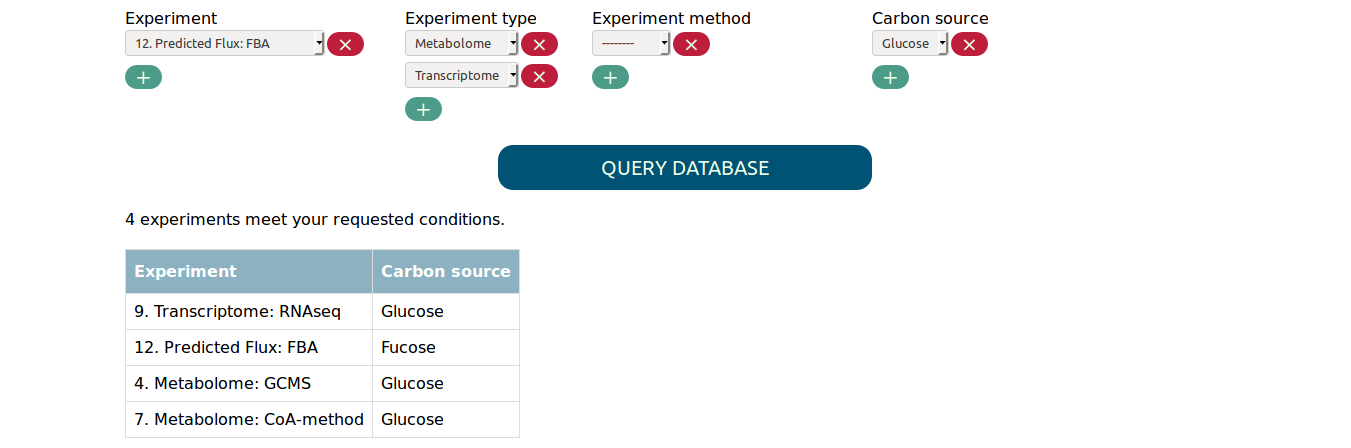
Finally, you have the option to directly select experiments with the experiment tab. Experiments select in this tab get added to the set of matched experiments, regardless of the other selected parameters. This way you can, for example, add a single flux simulation that uses fucose as carbon source to the transcriptome and metabolome experiments that use glucose. Adding only a single experiments would be otherwise difficult if there are many flux experiments that use fucose.
Once you are satisfied with the matched experiments you can click “QUERY DATABASE”, which will take you to the Data View.
Using the Data View
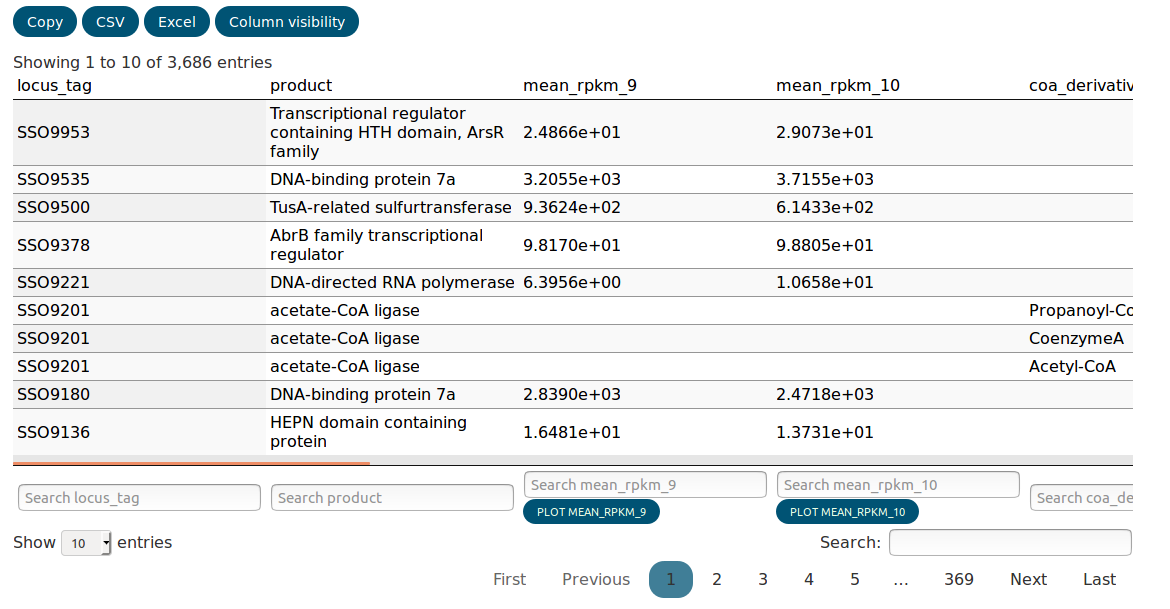
Assuming you selected all transcriptome and metabolome experiments with glucose or fucose as carbon source, you would be presented the following in the Data View.
At the top you see a table summarizing the matched experiments again. Then you can see some widgets that allow you to perform some preliminary analysis. We return to them later.
Farther down on the page is the data table that contains the actual integrated experimental data. The biological index, i.e. the biological objects the data map to, always precedes the numerical data for every type of experiment. Every column is suffixed with the id of the experiments it belongs to. The data is integrated in the way that loci and metabolites that are related to each other (e.g. by the encoded enzymes) appear in the same row. This leads of course to partial duplication of data if one locus is related to many metabolites.
The data table is searchable and columns can be completely hidden
using the Column visisbility tab. The data can also be copied to
the clipboard or exported as CSV or Excel. Hidden columns and
data that was filtered out with the search will not be exported.
The distribution of every column can be plotted as a histogram using the button at the bottom of the column. To plot a scatter plot comparing two experiments, the widget above the table can be used. The generated plots will be appended to the bottom of the page. You can remove them again simply by clicking on them.
Fold changes can be calculated and added to the table using the other widget above the table. If you are interested in multiple fold changes at the same time you can add more rows for specifying the experiments to be compared.
Using the Admin interface
The Admin interface presents you a page for each Model
that contains data in the database. You can browse the entries, add new
ones or change existing ones using simple forms.
For uploading larger datasets, the Admin interface (or short Admin) is equipped with support for spreadsheet upload.
Uploading data for BiologicalModels
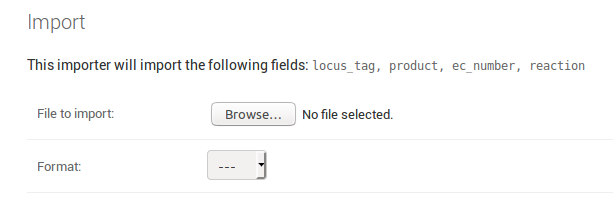
When you go the the IMPORT tab on a model’s page
you are prompted to upload a file and specify the file format.
The page also shows you the fields that will be imported. For an
exemplary Locus model the page could look like this:
The required fields must be included as column in the spreadsheet file
you upload. As one locus can be related to many reaction, all related
reaction must be present in the reaction column, separated by commas.
A valid for uploading Locus data could look like this:
Exemplary table for the data upload to the Locus model (data from Sulfolobus solfataricus).
| locus_tag | product | ec_number | reaction |
|---|---|---|---|
| SSO0299 | transketolase | 2.2.1.1 | carb_ppp_2TRANSKETO-RXN,carb_ppp_2.2.1.1_1TRANSKETO-RXN,cof_thiamin_plp_2.2.1.7_DXS-RXN |
| SSO0302 | Chorismate mutase | 5.4.99.5 | aa_tyr_PREPHENATEDEHYDROG-RXN |
| SSO0304 | 3-deoxy-7- phosphoheptulonate synthase | 2.5.1.54 | aa_phe_tyr_trp_shiki_DAHPSYN-RXN |
| SSO0305 | 3-dehydroquinate synthase | 4.2.3.4 | aa_phe_tyr_trp_shiki_3-DEHYDROQUINATE-SYNTHASE-RXN |
| SSO0306 | shikimate dehydrogenase | 1.1.1.25 | aa_phe_tyr_trp_shik_RXN-7968_NADP |
| SSO0307 | chorismate synthase | 4.2.3.5 | aa_phe_tyr_trp_shiki_CHORISMATE-SYNTHASE-RXN |
| SSO0308 | shikimate kinase | 2.7.1.71 | aa_phe_tyr_trp_shiki_SHIKIMATE-KINASE-RXN |
| SSO0309 | 3-phosphoshikimate 1-carboxyvinyl transferase | 2.5.1.19 | aa_phe_tyr_trp_shiki_2.5.1.19-RXN |
| SSO0311 | 3-dehydroquinate dehydratase | 4.2.1.10 | aa_phe_tyr_trp_shiki_3-DEHYDROQUINATE-DEHYDRATASE-RXN |
Note that the first row contains two entries for reaction.
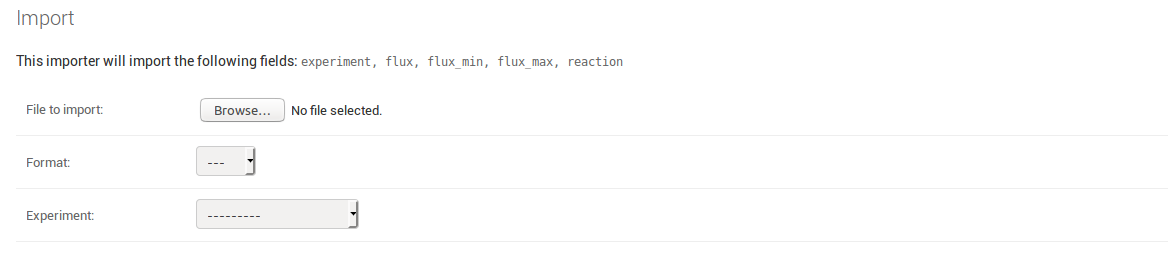
Uploading data for MeasurementModels
Uploading actual experimental data follows the same principle as uploading biological data. The only difference is that you need to choose the experiment the data belongs to at the moment you upload it. Therefore you do not need to include an experiment column in your spreadsheet, even though it is listed as a field that is going to be imported.
Whenever your uploaded data does not make it through the validation process, you will be informed about what went wrong in which row of the dataset. This helps to ensure that the data stored in the database remains consistent.